Common ClickHouse problems — and how to diagnose and fix each one
ClickHouse rarely fails quietly. When something is wrong you usually get a loud, specific error or a query that suddenly takes 40 seconds instead of 40 milliseconds. The good news: the same handful of problems account for the overwhelming majority of incidents, and almost all are diagnosable from the system tables in a couple of minutes. This is a field guide — symptom, real root cause, a diagnostic query, and the fix.
Problem 1: Too Many Parts
The most common production error, and it almost never means what people assume. It does not mean your disk is full — it means you're creating parts faster than background merges can consolidate them. The two usual culprits are small, frequent inserts and over-partitioning.
SELECT database, table, count() AS active_parts
FROM system.parts WHERE active
GROUP BY database, table
ORDER BY active_parts DESC LIMIT 20;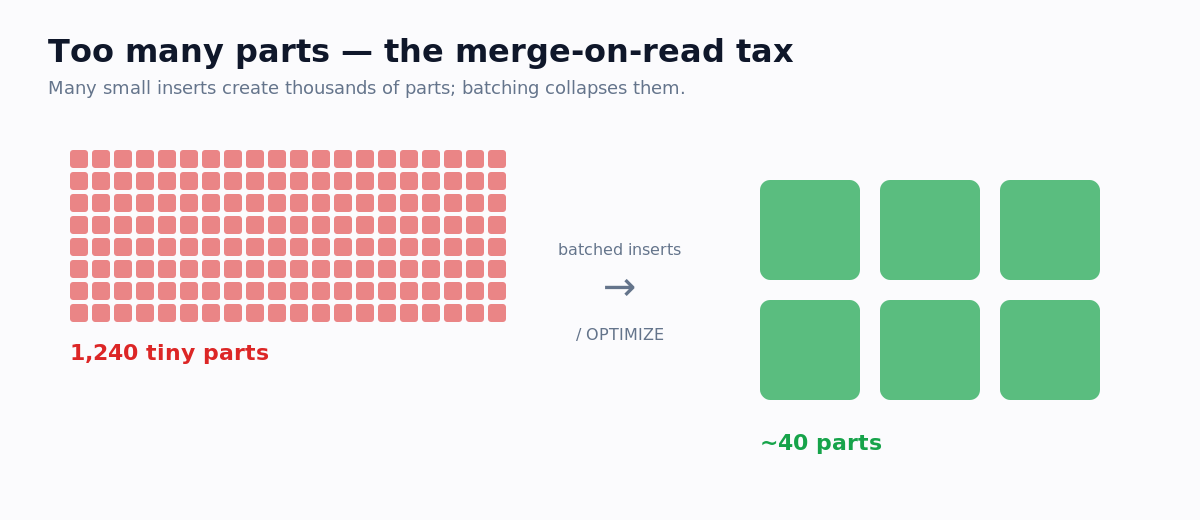
Fix it in order of preference: batch inserts to tens of thousands of rows; if you can't batch on the client, enable async_insert; if a too-granular partition key is the cause, coarsen it to monthly. Raising parts_to_throw_insert only hides the symptom. The full deep dive is in our dedicated post on too many parts.
Problem 2: Memory Limit Exceeded
A query or insert needs more RAM than its budget. ClickHouse tends to materialize the working set before spilling, so the usual triggers are large GROUP BY on high-cardinality keys, JOINs with a big table on the right, ORDER BY over huge results, and oversized insert blocks.
SELECT query_id, formatReadableSize(memory_usage) AS mem,
       elapsed, query
FROM system.processes
ORDER BY memory_usage DESC;
Address the query, not just the limit. Allow spill to disk with max_bytes_before_external_group_by, put the smaller table on the right of a JOIN (or use a Dictionary), and pre-aggregate with materialized views so dashboards never touch raw data. Raise max_memory_usage only as a deliberate, monitored change.
Problem 3: Slow queries on an idle cluster
A query reads far more rows than it logically should. CPU isn't pegged, disk isn't saturated — it's just reading too much. Almost always a mismatch between the WHERE clause and the table's ORDER BY: the sparse index can only skip data on the leading sort columns.
EXPLAIN indexes = 1
SELECT count() FROM events
WHERE country = 'DE' AND event_time > now() - 7;
If nearly all granules survive, the index isn't helping. Fix by re-ordering ORDER BY so the filtered column leads, adding a skip index, or adding a projection — then confirm with EXPLAIN again. Our post on why ClickHouse queries are slow walks through all seven causes.
Problem 4: Duplicate rows
SELECT count() returns more rows than you inserted. ClickHouse does not enforce uniqueness — the primary key is a sorting index, not a constraint. Duplicates come from insert retries, at-least-once streaming, or the assumption that ReplacingMergeTree dedups instantly (it collapses duplicates only at merge time).
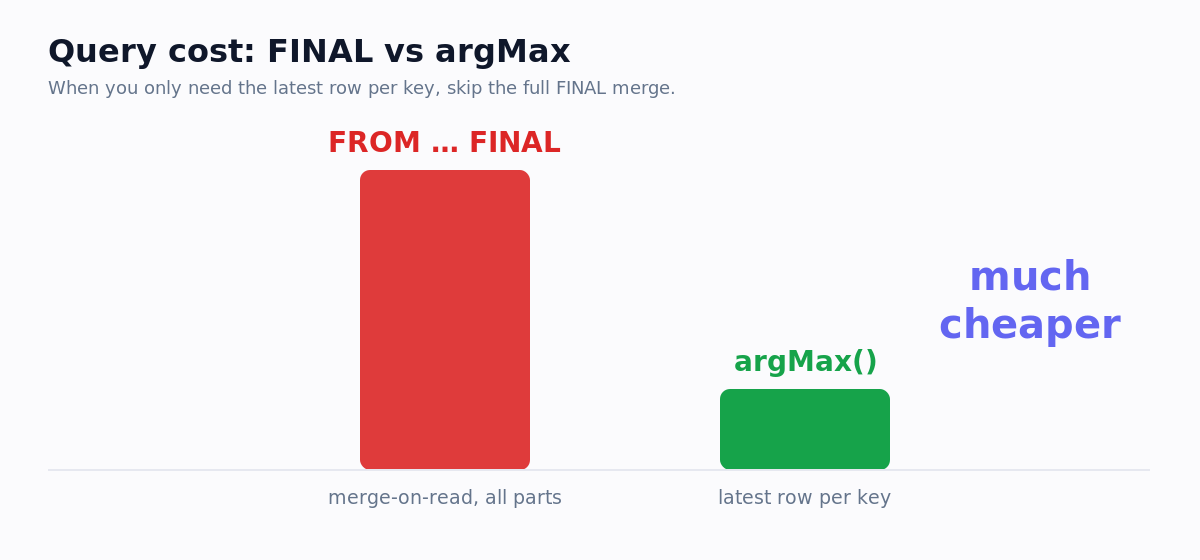
Use ReplacingMergeTree(version) and read with argMax(col, version), rely on built-in block-level insert dedup for byte-identical retries, or deduplicate upstream with a unique token. Don't schedule mutations to delete duplicates — it's expensive and fragile. See our explainer on FINAL for the trade-offs.
Problem 5: Storage growing faster than your data
Disk climbs even though row counts are stable. Usual causes: oversized data types, an ORDER BY that scatters similar values so columns compress poorly, abandoned parts from failed mutations, or simply no TTL on data nobody queries.
SELECT table,
  formatReadableSize(sum(data_compressed_bytes))   AS compressed,
  round(sum(data_uncompressed_bytes)
        / sum(data_compressed_bytes), 2)            AS ratio
FROM system.columns
WHERE database = currentDatabase()
GROUP BY table ORDER BY sum(data_compressed_bytes) DESC;
Right-size your types (often 30–50% back on its own), reconsider ORDER BY so low-cardinality columns lead and compress, and add TTL to expire old data. Our guide on reducing ClickHouse storage costs covers this end to end.
Problem 6: One query takes down concurrency for everyone
When one heavy query runs, unrelated fast queries crawl or queue. The cause is no resource isolation — by default a single expensive query can consume most of the CPU, memory, and I/O. Use quotas and settings profiles to cap per-user memory, execution time, and rows read, and route heavy ad-hoc workloads to dedicated replicas.
SELECT query_id, user, elapsed,
       formatReadableSize(memory_usage) AS mem, read_rows, query
FROM system.processes
ORDER BY elapsed DESC;
A repeatable triage routine
When something feels wrong, run these in order: system.processes for what's happening now, system.parts for part-count and storage pressure, system.query_log for what's been expensive over the last day, and system.replication_queue if replicated tables are involved. Ninety percent of incidents reveal themselves in those four.
FAQ
How do I permanently fix Too Many Parts?
Stop creating parts faster than merges can keep up: batch inserts to tens of thousands of rows, enable async_insert if you can't batch on the client, and avoid over-granular partitioning. Raising the part limit only delays the problem.
Does ClickHouse deduplicate rows automatically?
Not by enforcing uniqueness. It offers ReplacingMergeTree (collapses duplicates at merge time) and automatic block-level dedup for identical retried blocks. Neither is an instant unique constraint, so design queries to tolerate temporary duplicates.
Why is my query slow when the server isn't busy?
It's almost certainly reading too many rows because its WHERE filter doesn't match the table's ORDER BY. Confirm with EXPLAIN indexes = 1, then re-order the sort key, add a skip index, or add a projection.
Catch these before they page you
Running these checks once is easy; doing it continuously across every table, and knowing which finding will bite next week, is the hard part. OptiHouse scans your cluster read-only, surfaces part-count pressure, schema waste, and risky query patterns, and ranks them by cost. Try the free optimizer or start a 14-day trial.