Why is my ClickHouse query slow? 7 common causes
A ClickHouse query that takes seconds is almost never a hardware problem — it is reading data it does not need. Start in system.query_log and rank by read_bytes; then check your worst queries against this list.
SELECT query_duration_ms, read_rows,
       formatReadableSize(read_bytes) AS read,
       normalizeQuery(query) AS pattern
FROM system.query_log
WHERE type = 'QueryFinish' AND event_time > now() - INTERVAL 1 DAY
ORDER BY read_bytes DESC LIMIT 20;
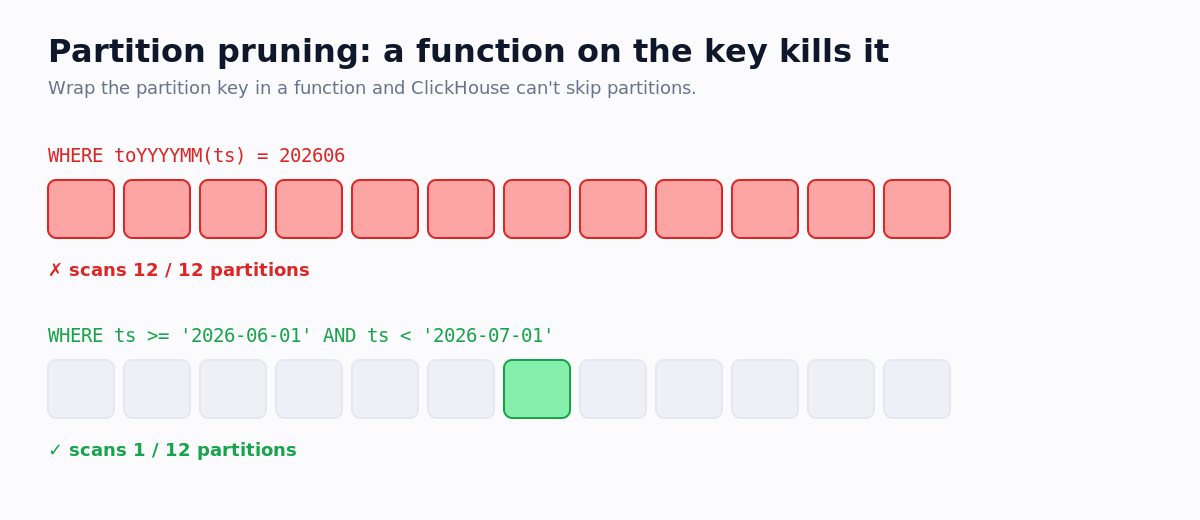
1. A function on the partition key breaks pruning
Wrapping the partition key in toYYYYMM(ts) or toDate(created_at) forces ClickHouse to evaluate the function on every row before it can filter, so it never skips partitions. Use a direct date range instead.
2. No PREWHERE on a wide table
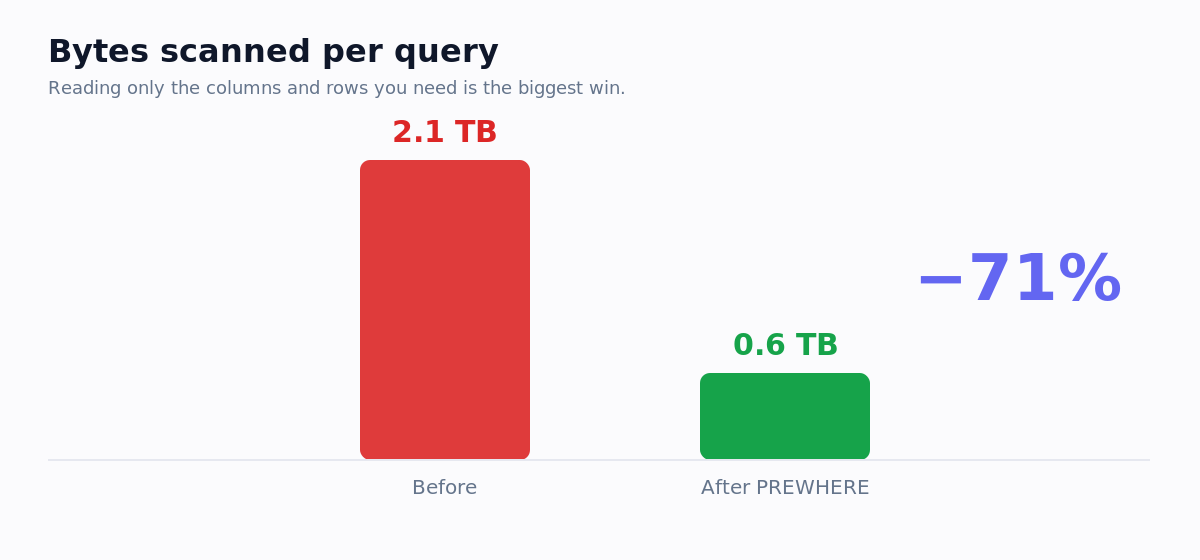
PREWHERE reads the filter columns first and only fetches the wide columns for surviving rows. On a selective filter over a wide table this is the single biggest win.
3. FINAL on every read
FROM ... FINAL forces a merge-on-read across all parts. Where you only need the latest row per key, argMax or LIMIT 1 BY does the same job far cheaper.
4. A memory-heavy JOIN
The default hash join builds the entire right table in memory. Put the smaller table on the right, and switch join_algorithm to grace_hash or parallel_hash when the right side is large.
5. SELECT * on a columnar store
ClickHouse only reads the columns you ask for. SELECT * reads every column off disk — list only the columns you actually use.
6. Too many small parts
If a table has thousands of tiny parts, every query pays a merge-on-read tax. This usually comes from inserting row-by-row instead of in batches.
7. A missing skipping index
Filtering frequently on a non-primary-key column forces a wider scan. A minmax or bloom_filter data-skipping index lets ClickHouse skip granules that cannot match.
Find them all automatically
OptiHouse runs every check above across your whole query log on each scan and ranks the findings by dollar impact, with the rewritten SQL ready to copy. Paste a query in the free optimizer to see it in action.